Your Contracted Freight Rate Is Not What You Actually Pay One transporter per lane, or many? The answer decides more of your freight budget than the rate negotiation does.
Every freight tender ends the same way. Rates get compared, the lowest credible number wins, the contract is signed, and everyone moves on to the next thing. Then the year happens. Month-end arrives and the transporter who quoted so well on Jamshedpur–Kolkata has his fleet committed somewhere else. Someone in the plant makes six phone calls. A vehicle is arranged at spot, at a number nobody wants to write down. It gets booked as an exception. Next month, the same thing. By March, the rate you negotiated and the rate you paid have quietly parted ways — and almost no one in the organisation can tell you by how much. That gap starts with a decision made long before the rate discussion: on this lane, do we award the business to one transporter, or to several? ---
The question is not administrative. It is structural.
Award a lane to a single transporter and you buy something real. He knows he is getting 400 trips a year, so he can plan his fleet around it, hunt a return load, and price accordingly. You get one contact, one rate card, one performance conversation. When something breaks, exactly one person is responsible. Split the same 400 trips across four transporters and every one of them is planning around 100 uncertain trips. Nobody can build a return-load pairing. Everybody prices in the uncertainty. Your headline rate goes up. So single-award wins? Not quite. The single-transporter model has two failure modes, and both arrive late enough that the person who signed the contract has usually moved on. The first is concentration. Indian dispatch peaks are correlated. Steel, FMCG, everyone loads at month-end. When your one transporter's fleet is committed elsewhere in exactly the week you need it most, you have no contractual second option. You have a phone. The second is the ratchet. An incumbent holding 100% of a lane, with no visible competitor and no internal benchmark, has structural leverage at renewal. Year one's saving has a way of coming back in years two and three. ---
Multi-transporter is three different things, and people confuse them
This is where most freight strategy discussions go sideways. "Multiple transporters on the lane" describes three structures that behave nothing alike. Fixed percentage split — 50/30/20, agreed upfront. Real redundancy, a live internal rate benchmark, retained leverage at renewal. The catch: someone has to actually track whether the split was honoured, month after month, and correct the drift. On a spreadsheet, across 300 lanes, that does not happen. Primary with ranked backup — one transporter is primary, the load rolls down a waterfall when he refuses. This is the most common structure in mature networks and the most expensive one to run blind, for reasons we will come to. Contract panel with per-load bidding — a pre-qualified panel, with each indent allocated by reverse auction. Reverse e-auction platforms are commonly reported to save 7–11% on freight cost, and in a falling market they are excellent. But transporters cannot plan fleets against uncertain volume, so a pure-auction lane is the first one abandoned when capacity tightens. And an auction optimises for rate alone — unless service history is scored into the allocation, it will reliably hand your loads to your worst-performing transporter.
The number almost nobody measures
Here is the part that matters most, and it applies to every shipper running a primary-and-backup structure. Your effective freight rate is your contracted rate weighted by how often you actually get the primary vehicle. Each time a load falls past the primary, it costs more. Fall to the backup, you pay a premium. Fall to spot, at short notice, you pay considerably more. Research from MIT's Center for Transportation & Logistics on a large network tracked this across a full market cycle: primary carrier acceptance fell from roughly 80% to 63%, while spot acceptance nearly tripled — and the premiums paid rose as routing-guide depth increased. The commercial consequence is blunt. A lane contracted at ₹28,000 with 65% primary acceptance is not a ₹28,000 lane. It never was. There is a published illustration of exactly this gap: a bid event projecting 7.2% savings delivered 4.1% realised, because primary acceptance ran at 87% and rejected loads priced 22% above the awarded rate. Award savings and realised savings are two different numbers. Only the second one is money. So a question worth asking your team this week: what is our primary acceptance rate, by lane, over the last twelve months? If nobody can answer it, the freight rate on your contract is an estimate.
What large Indian shippers actually do
Lane-level award mechanics at Tata Steel, JSW or Jindal Stainless are not published, and anyone who tells you otherwise is guessing. What is visible is the shape of the sector.
Tata Steel runs a formal e-procurement infrastructure covering logistics and transport categories, and describes its e-auctions as market-driven negotiations based on total value — explicitly capable of including both price and non-price parameters. That distinction is the whole game. A well-run freight auction is not a lowest-price event. JSW Steel has publicly described a Logistics Centre of Excellence set up to reduce inbound and outbound freight cost, and more recently, the implementation of digital logistics solutions to track and monitor movement.
The generalised pattern across large Indian manufacturers looks like this: an annual lane-wise tender off historical volumes; pre-qualification on fleet, compliance and safety record; sealed bid followed by reverse auction on the high-value lanes; award tiered to L1/L2/L3 with defined shares; diesel escalation clause; penalty schedule on placement and transit; and quarterly review with reallocation of share based on measured performance. That last step is where the whole structure lives or dies. A tiered contract with no enforced reallocation is a single-transporter contract with extra paperwork. If L1 keeps his 60% regardless of whether he places vehicles, none of the redundancy you designed actually exists.
FMCG runs the same logic with sharper peaks. Month-end and festival concentration means the primary lane genuinely cannot be served by one fleet — so the contract has to anticipate the overflow instead of discovering it at 9pm on the 28th.
Where a TMS actually changes the answer
Not by magic, and not by conjuring trucks. By making the decision measurable.
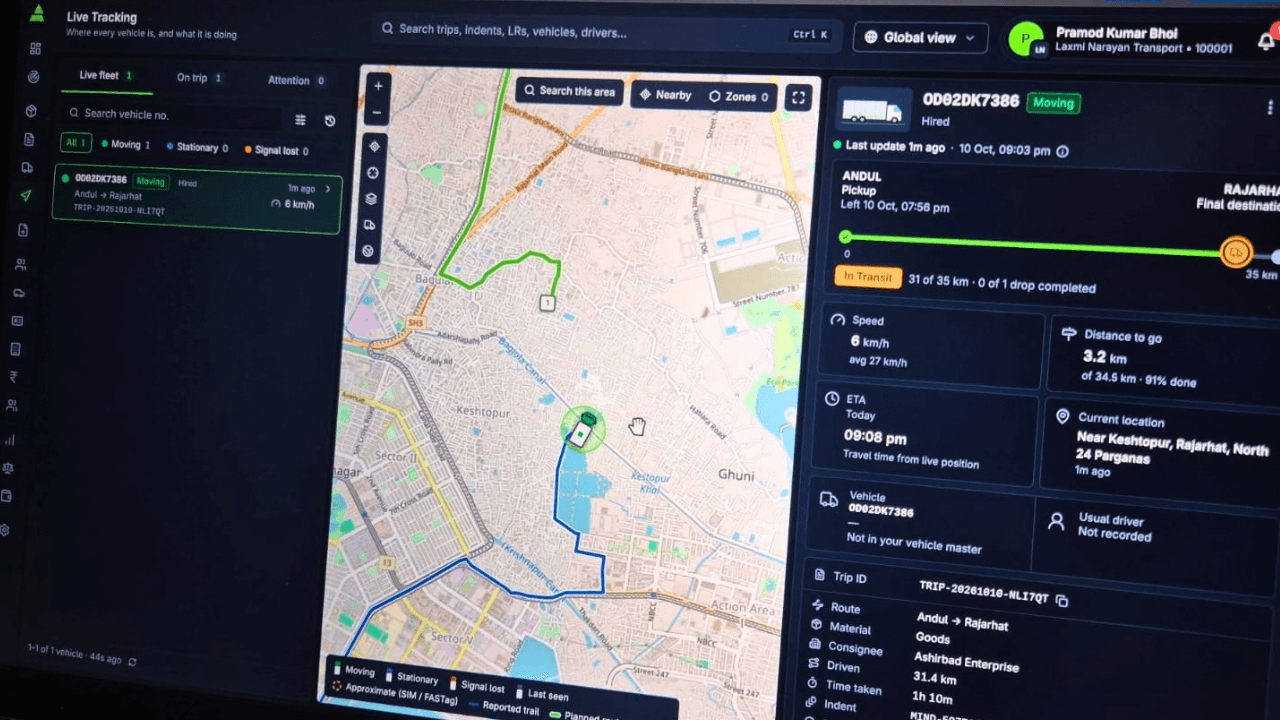
1- Automated indenting with a timed waterfall — the load goes to L1 with an enforced acceptance window, then rolls to L2, L3, spot. Every escalation is logged, so fallback depth stops being an invisible cost and becomes a reported metric. 2- Lane-wise rate and contract management — contracted rates held by lane, vehicle and commodity, with diesel escalation applied systematically instead of reconstructed at invoice time. 3- Transporter scorecarding by lane — placement compliance, on-time pickup, transit adherence, OTIF, POD lag. This is the evidence base that makes quarterly share reallocation possible instead of political. 4- Freight bill audit — invoice reconciled against contracted rate and approved accessorials. 5- Realised-versus-contracted rate reporting — the number most shippers cannot produce today.
Published benchmarks put TMS freight savings in a broad range: ARC Advisory Group has reported around 8.5%, and a Gartner survey found users typically expect 5–15% annually. Reverse auction procurement is commonly cited at 7–11%. A word on those numbers, because you will be quoted them by every vendor you meet. They are ranges from other people's networks. Whether any of it is available to you depends entirely on your baseline. A shipper already running disciplined lane-wise tiered contracts with active scorecarding has far less to recover than one running freight on WhatsApp and a spreadsheet. Anyone who quotes you a percentage before looking at your baseline is selling, not diagnosing.
The same applies to service. "Improves SLA by 10%" means one thing if it is 78% to 88%, and something meaningfully smaller if it is 78% to 85.8%. Ask which. Ask which SLA, too — placement compliance moves quickly under a system, because indent discipline is directly system-controlled. Delivery OTIF moves more slowly, because the road is not.
Sources referenced
MIT Center for Transportation & Logistics: https://ctl.mit.edu MIT CTL Research Publications: https://ctl.mit.edu/publications Tata Steel Europe Supplier Portal: https://www.tatasteeluk.com/suppliers Tata Steel Europe (Supplier Information): https://www.tatasteeluk.com JSW Steel Annual Reports: https://group.jsw.in/investors/steel/jsw-steel-financials-annual-reports Tata Steel Integrated & Annual Reports: https://www.tatasteel.com/investors/ ARC Advisory Group: https://www.arcweb.com Gartner Transportation Management Systems: https://www.gartner.com/en/supply-chain FreightWaves: https://www.freightwaves.com LightSource Procurement Glossary: https://lightsource.ai/glossary Logistics UK: https://logistics.org.uk RXO Insights: https://rxo.com/resources Capstone Logistics Insights: https://www.capstonelogistics.com/insights